Reporting - Quick Guide
This is a quick step by step guide to access our most popular reports:
- Registration list
- Attendee list
You can learn more about reporting in our article here which gives a great overview of the power of our reporting tools and the insights they can bring.
Article Contents:
Video walkthrough
Step by step guide
- 1
- Click on Reports navigation bar. Select Projects on the left.
- 2
- Click on your desired project from the list in the main window.
- 3
-
The next page you see is a reporting overview of your event including traffic, referral, conversion and engagement data. You can limit this information based on the Ticket Type registrants have been assigned, if this was enabled. For more detail on these reports please contact our support team

- 4
-
Navigate to the download icon towards the right-hand side of the page, just next to update. You will then see a list of options.
-
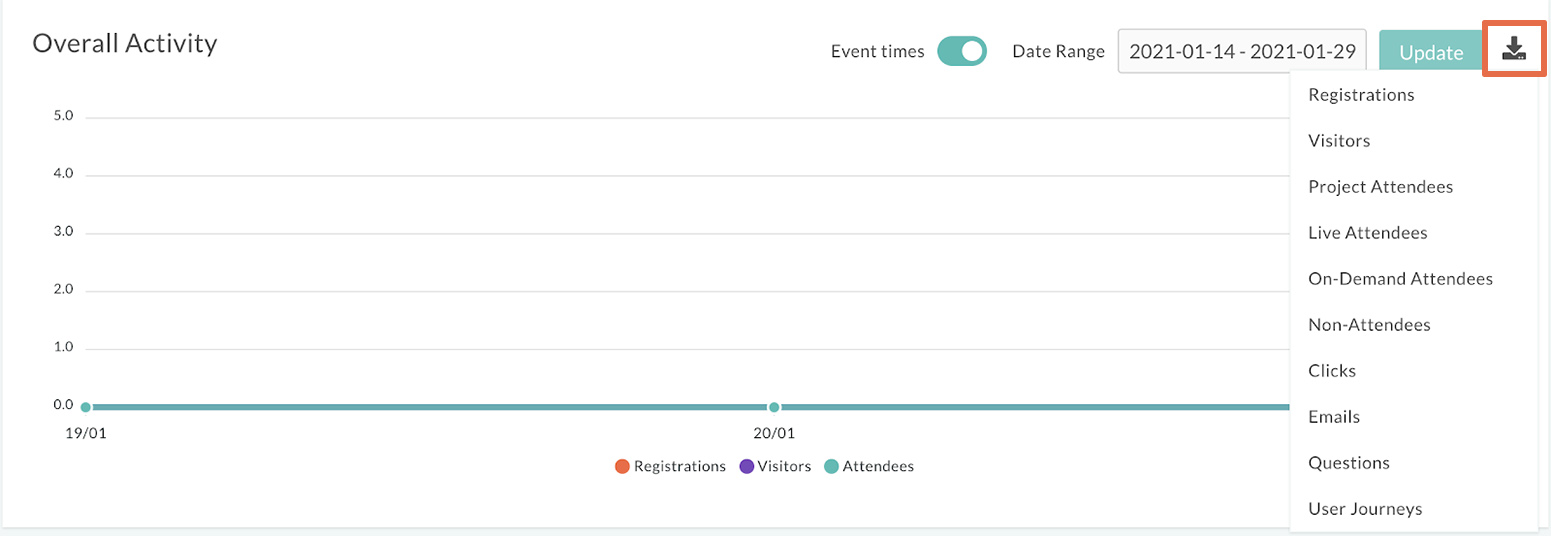
- From here you can download CSV files that contain lists of registrations, attendees, questions and non-attendees.
- The download should start automatically once clicked.


Definitions
Relating to the above screenshot, it is important to know what each category relates to and in this section we have:
- Registrations - This is the report of who signed up to your event by the means of your registration page.
- Visitors - This is the report to show many people visited your registration sign up page but did not register and proceed to your event page.
- Attendees - This is the report to who attended your event page and watched the session.
Now, we will look into the options for downloadable reports and explain what they mean:
- Registrations - This is the report of who signed up to your event by the means of your registration page
- Visitors - This is the report to show many people visited your registration sign up page but did not register and proceed to your event page. This report will also display what time a participants session has ended Note: Each person can have multiple sessions so be sure to find their last session.
- Project Attendees - This is the report to show who attended your overall project. For example those who logged onto the page and didn’t then progress onto watching your event.
- Live Attendees - This is the report to show who watched your event at the time of first transmission whether your event is live, simulive or hybrid you can see all thoughts who watched it.
- On-Demand Attendees - This is the report to show who is watching your on-demand content. Note that this will not apply if you have opted out of making your event available on demand once your live or simulive session has been broadcast.
- Non- Attendees - This is the report which shows who registered but did not attend your event during the initial transmission.
- Clicks - This is the report to indicate how many clicks your event has had.
- Emails - This report will give you an in-depth report to who opened your emails. Weather that being your 24 hour reminder or 1 hour reminder.
- Questions - This is the report to show who asked a question during your event. You can see the contact details of the person as well as the question asked. (Note that if you have opted out of live interactivity, this will not apply.)
- Polling - This is the report to show who has participated in your polls during your event. (Note that if you have opted out of live interactivity, this will not apply.)
- User Journeys - This is the report which showcases your user journey across your event. It will give you information about what each user has clicked or navigated to within your event page
- Total Active - This will outline how long the user was active on your event page. This is measured by the page being the top view on the user's device. For example, if the user is watching and then minimises the page to check emails then they will no longer be active.
- Total Watching - This is how long the user has been playing the video. Unlike total active, this is measured throughout regardless of whether the video is in front view or not.
- Engagement Score - This score takes into account several factors to give an attendee an overall score to indicate their engagement in an event. The calculation takes into account the number of questions an attendee asked, the number of polls they responded to along with their watching time versus the total event duration.
What's in the reports?
Here's a quick explanation of some of the key data you'll see in your reports.
Column Title |
What Is It? |
| id | This is a unique identifier for the streamGo platform to help the system track the interesting stuff! |
| name, surname and email | These are the minimum fields for registration. |
| Ticket Types | This will indicate any tickets a user has been given. |
| Registration form fields | These might be job title, company name etc. These columns will show all the data your registration form asked for. |
| Session time | How long the user spent on any of the project or event pages. This could be the registration page and confirmation page as well as the event viewing page. This is only counted when the page, or event video are actively being seen by the user / at the front of their tabs or windows. If a report shows higher session time than video time, the user has likely been on the page for some time before or after the video has started / ended.
|
| Video time | This is how long the attendee played the event video for (even if it is playing in a tab or window that is not at the front of the user's screen). If a report shows higher video time than session time, this means the video was playing while the user was viewing other tabs on their screen.
|
| Questions | How many questions the attendee asked. |
| Clicks | How many times the user clicked links or content across the project including between pages or to alternative events.
|
| Referrer / Referrer Type | Some website pass on referral data, if they do this will be shown here to show where the user came to your event pages from. |
| Ref_data | This is populated from any referral tags you may have set up. View our help article on these tags here » |
| Registration_date | The date and time of the user's registration. |
| Percent_viewed | How much of your event did the attendee watch? |
| Score | This is our unique "Engagement Score" that we apply to attendees. It takes into consideration how much of the event the attendee watched, clicks, questions and more to give you insight into your most and least engaged attendees. |
| Unsubscribed | This will highlight anyone who has unsubscribed from the event notification emails. |